
If you had asked me 3 years ago if I sketched out or created wireframes for my dashboards before I built them in Tableau, I would have laughed a resounding, “No, are you crazy? I don’t have time for extra work!” I don’t think I’m alone in that initial sentiment. I’m here to tell you that since I started using Figma for both design elements and full dashboard prototyping, I can confidently say that prototyping has significantly improved my dashboard builds and streamlined the development process.
Build Better Dashboards by Prototyping
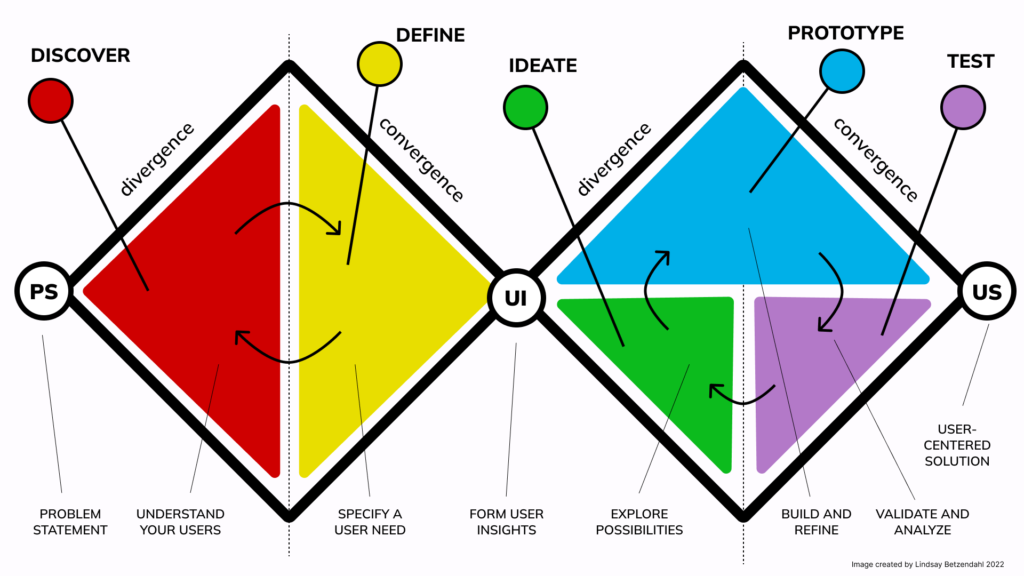
In 2022, I had the opportunity to speak at the Tableau Conference in Las Vegas on prototyping and why it’s worth adding it to your Tableau development process. While the presentation wasn’t recorded live, you can listen and watch me, Tableau Visionary and Partner and Senior Consultant at HealthDataViz, alongside fellow Tableau Visionary and data viz friend, Autumn Battani from PhData, present our famous TC 2022 conference talk at a Analytics Tableau User Group meeting. We share our knowledge about the design thinking process and how prototyping is an essential, but often overlooked, part of the data visualization design process.
The What, Why, and How of Getting Started
What is prototyping? It is a complete user experience without a fully developed dashboard and without any “real” data.
To be more specific, prototyping:
- is an early low-fidelity concept of a dashboard, report, or visual display
- shows metrics, chart types, layout, and possible interactivity without actual data
- is a way to obtain early feedback from users on the design and direction
- can help you validate users’ needs and POV to ensure the design solves their problem
Are you now wondering if prototyping will add time to your overall project timeline?
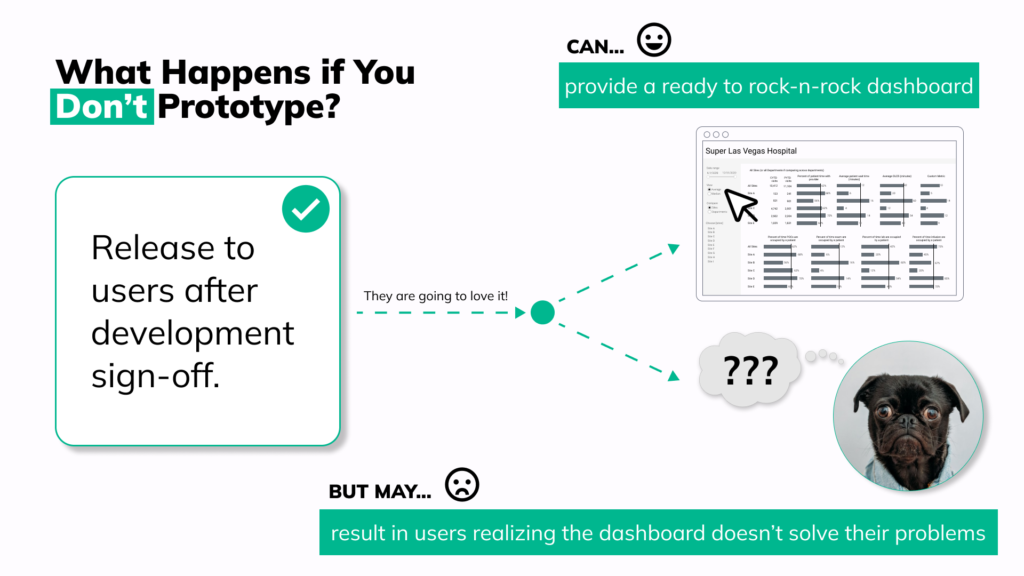
What could happen if you don’t prototype and instead developed a fully functioning dashboard first?
- You could show end users a functioning visual to start using, but
- You might have to unwind or edit complicated and time-consuming calculations, charts, and interactivity because now they have lots of feedback and wishes, and
- You might end up with tedious design and development change requests you weren’t anticipating (“We need you to change this blue to green everywhere it’s found in the suite of dashboards you just built.” UGH!), and
- You could discover that what you built doesn’t solve their exact problem you designed for.
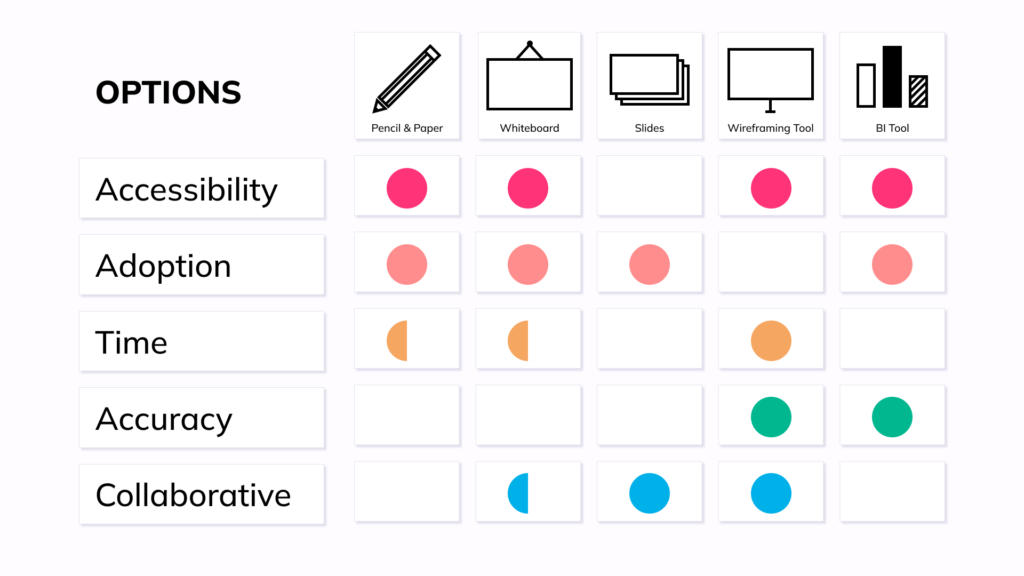
Lucky for you, there are lots of prototyping tools available. Some tools are easy to use, like pencil and paper, but not very accurate. Others are collaborative to use, such as slides, but more time consuming to create in.
To learn even more about the above summary plus prototyping best practices, check out the video and sign up for our blog emails so you don’t miss any of our upcoming data viz and design posts from the HealthDataViz team!