
Author: Lindsay Betzendahl
-
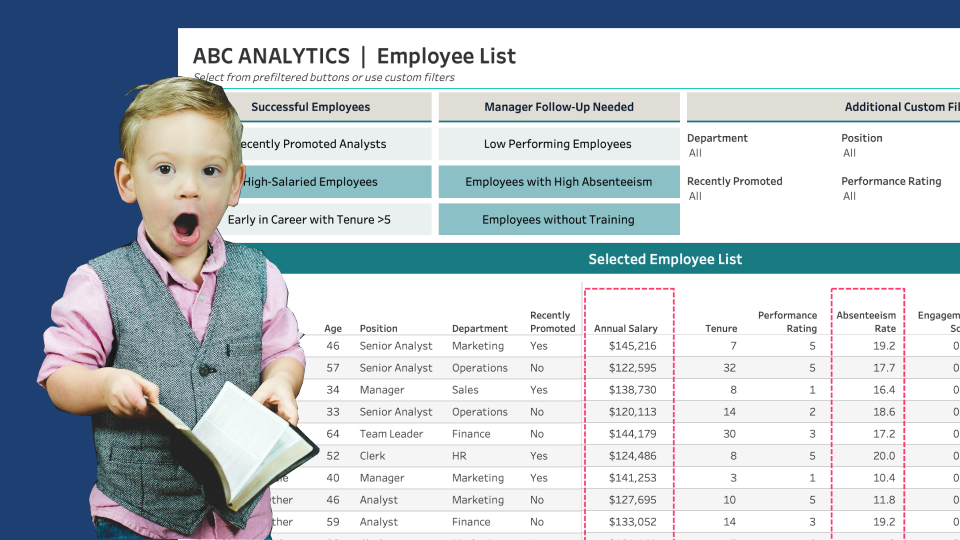
Custom Lists with Parameter-Driven Filter Buttons
Throughout my years working in data visualization, I have experienced an intriguing evolution. When I started using Tableau 10 years ago, I was interested in two vastly different ends of the spectrum of data visualizations: foundational concepts, such as building a bar chart and calculating aggregations accurately, and impractical concepts, such as creating a radial…
-

Exploding Pie!! But Why??
For the past five years as a consultant at HealthDataViz, I have worked with Connecticut-based organization The Donaghue Foundation to design and develop infographics for their annual reports. The organization funds research that promotes knowledge of practical benefits to improve health. Each year, my job was to review curated information pulled from awarded grantees’ research…
-
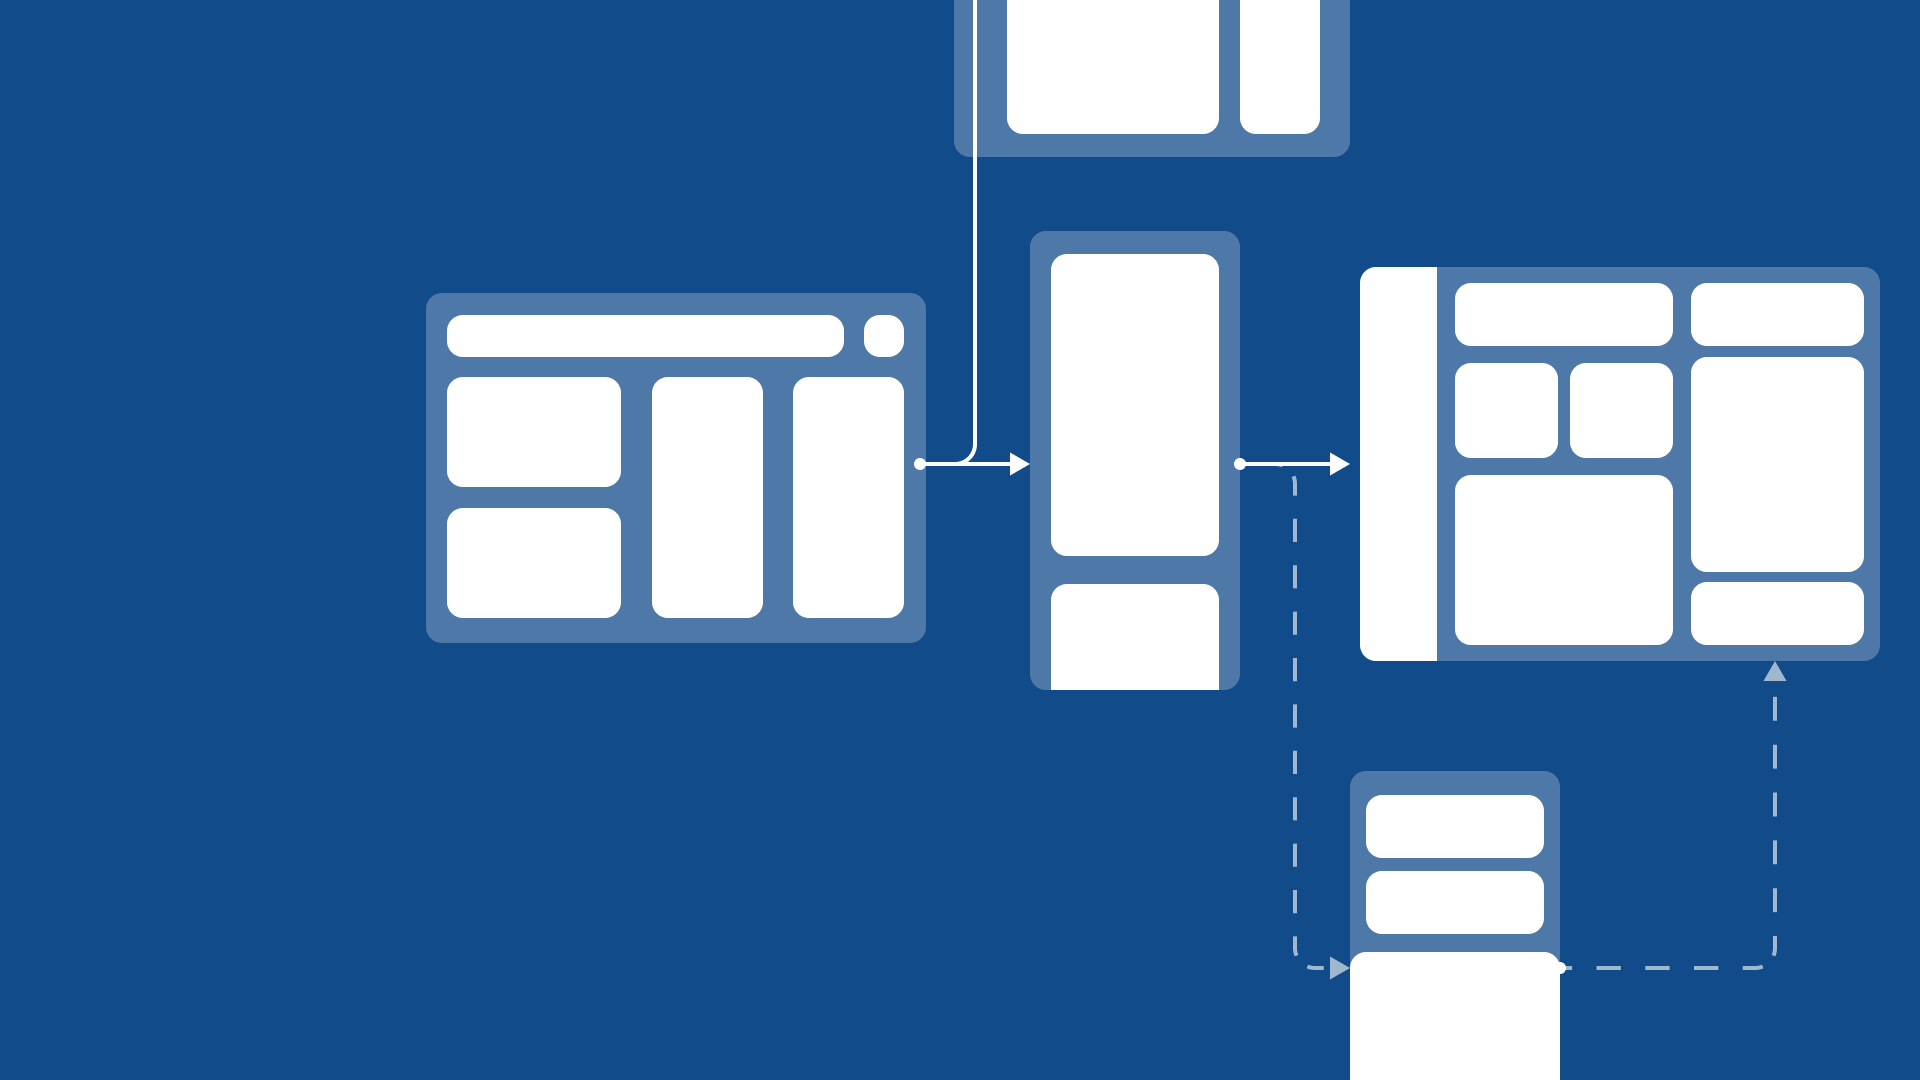
Prototyping: Building Better Dashboard Designs
If you had asked me 3 years ago if I sketched out or created wireframes for my dashboards before I built them in Tableau, I would have laughed a resounding, “No, are you crazy? I don’t have time for extra work!” I don’t think I’m alone in that initial sentiment. I’m here to tell you…
-

Why Constraints Make You a Better Designer
Constraints: Kryptonite or Door to Creative Innovation? In my work creating data visualizations, I often hear designers complain that constraints are their kryptonite or, perhaps worse, a barbed wire prison fence around their creative freedom. But if we change our thinking, constraints can be the inspiration to break out of old habits, experiment, and try…
-
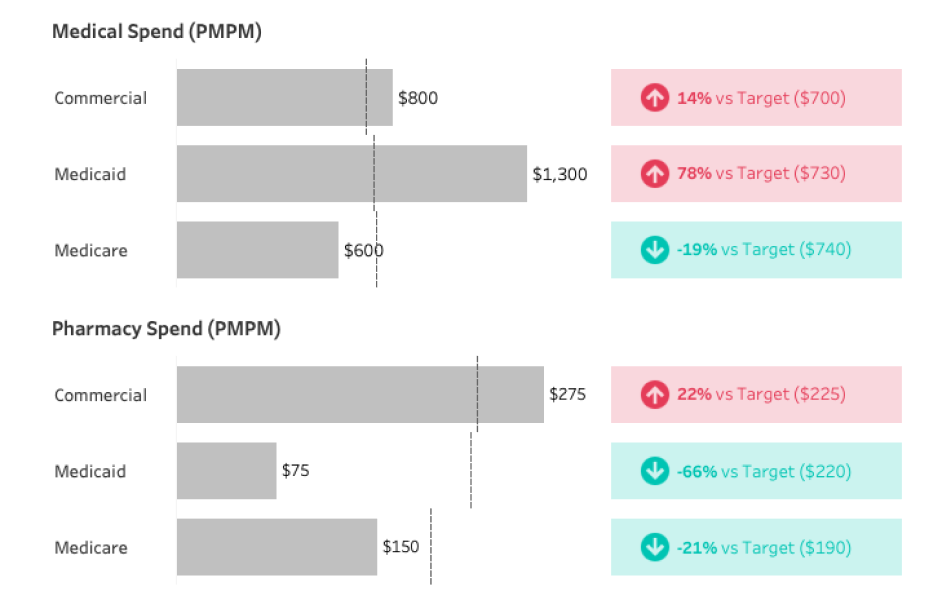
Clever Ways to Use Indicator Icons
It’s not uncommon for me while designing a data visualization to wrestle with two, seemingly, competing priorities: successfully visualize all necessary data elements and charts on the dashboard and minimize the noise so the most important pieces of the data are easy to find. As Kathy Rowell, HDV Principal and Cofounder, mentions in her post…