
Tableau is a data visualization tool, and if you use it frequently, you are aware of its amazing strengths and occasional weaknesses. Tableau is not designed for image creation or, frankly, image use. Because of this, there are considerations and workarounds to ensure images maintain quality and are easy to use within Tableau. Remember, Tableau is a tool to help you see and understand your data – and that it does well!
As a designer, I’m hyper-aware of how using external design tools and images has entered the Tableau space. I love the intersection of two needs and two tools. Why? It creates an opportunity for innovation and creativity.
Here, I will share a few tips and tricks for using images in Tableau dashboards.
Why Images in Tableau Can Be Tricky (and Often Blurry)
While Tableau is primarily a data visualization tool, design elements like background images, logos, and icons are becoming more common as developers aim to create polished and engaging dashboards. However, incorporating images into Tableau isn’t always straightforward—one of the biggest challenges is image clarity.
Even when importing a high-quality image, you may scratch your head when that image appears a bit blurry in Tableau. You wonder, how can that be?!
For example, I have an image that I want to be in the background of a landing page I’m developing. I have set the image to be 1300 x 800 pixels, which is the exact dimensions of my dashboard, and it looks clear when viewed in my image preview application.

However, after placing the image into the dashboard and setting the image options to “Fit Image” and “Center Image,” the image becomes slightly blurry (see Figure 2). What exactly is going on here?
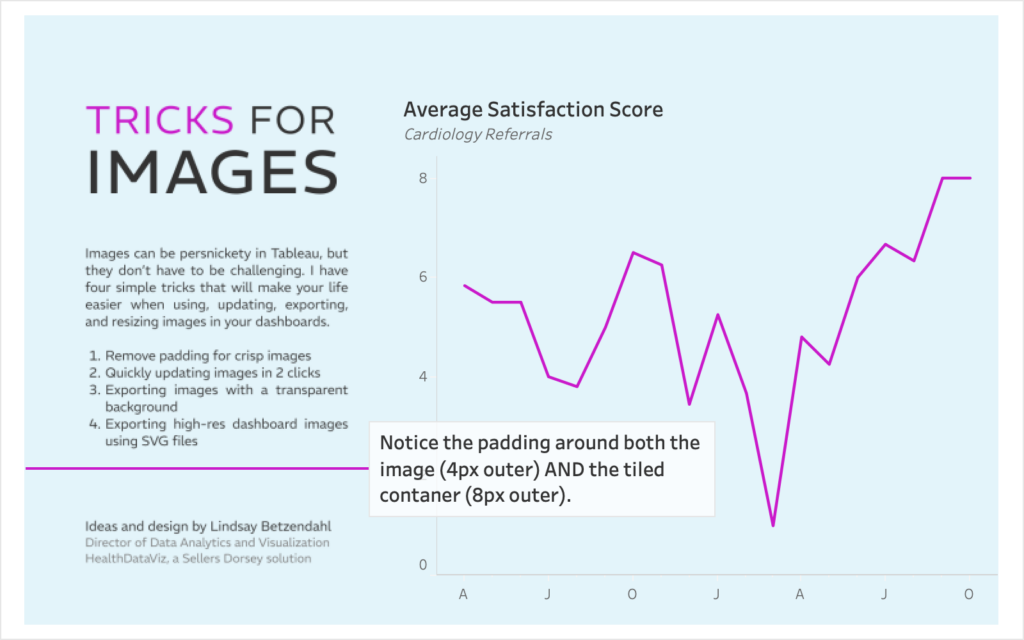
The reduction in clarity occurs because Tableau resizes images based on the container they are placed in (when “Fit Image” is selected), often introducing unwanted scaling and compression. Another hidden culprit is Tableau’s default padding. When an image is imported, Tableau automatically applies padding that subtly alters the display size, making it difficult to achieve a perfect match.


To counter this, you should manually adjust the padding settings (in the Layout pane) to 0 on all sides, on both the image and the container, and match the image’s pixel dimensions to that of the container in Tableau.

By carefully managing image size, container dimensions, and padding, you can ensure that imported images remain sharp and visually appealing in a Tableau dashboard.
Update an Image in Tableau with Two Clicks
Updating an image in Tableau might seem like a hassle, but using a simple trick saves time and effort. Instead of manually replacing the image through the “Choose Image” option and reconnecting it to your updated image file, you can refresh it in just two clicks.
Here’s how:
- Save your updated image with the same name and in the same file location as the original image (save over the original image). This ensures that Tableau still recognizes the file path.
- In Tableau, delete the existing image from your dashboard.
- Press Undo (Ctrl + Z or Cmd + Z on Mac).
That’s it! The updated image will appear instantly without needing to reselect the file. This quick method allows for seamless image updates, making it especially useful for refining your dashboard’s background designs, logos, or any other static images.
Export Dashboard with Transparent Background
Worksheets and dashboards within Tableau have a default white background shading. When either is exported as an image, the white fill is preserved. This can pose problems when later importing that same image into a document or PowerPoint slide deck where it might overlap with other elements or be on a background other than white.
However, it’s straightforward to export or copy an image of a dashboard or worksheet with a transparent background by following these steps:
- Remove the default background fill by going to Dashboard > Format and select None from the Dashboard Shading selection.
- To remove the background fill from each worksheet, right-click on the worksheet and select Format. Under the Format Shading pane (paint bucket icon) select None from the Worksheet shading.
- Either export or copy the dashboard by going to Dashboard > Export Image or Dashboard > Copy Image.
- Import or paste the image into your document, and you will see that the image has a transparent background.
Images with transparent backgrounds can be useful when overlayed on a document that already has a background color or to avoid obfuscating images such as a company logo in a PowerPoint slide deck.
Create High-Resolution Dashboard Images
Tableau’s built-in image export options often fall short when it comes to high-resolution output, especially for embedded elements like logos or background images. If you’ve ever exported a dashboard or chart only to find that the quality is noticeably reduced, there’s a better way!
Did you know that you can export a dashboard or worksheet image as a Scalable Vector Graphic (*.svg) file? By exporting your Tableau dashboard as an SVG, you preserve the vector quality of the data visualization created within Tableau. If desired, you can combine it with externally created SVG images.
How to export a dashboard as an SVG file:
- Remove any images, including background images, from the dashboard.
- Remove the dashboard and worksheet background shading (see the section above for removing backgrounds).
- Use Tableau’s Dashboard > Export Image function and select Scalable Vector Graphics (*.svg) from the drop-down as the file format. Save to a desired folder.
- Once downloaded, import the SVG file and any original image files (assuming they are also vectors) into a vector-based design tool, such as Adobe Illustrator or Figma, to merge the files together.
- From there, export a final image, which will have the best resolution and ultimate scalability.
Below, in Figure 7, you can see my original background image (on the left) created in Figma next to the exported SVG file from Tableau (on the right), which includes the charts, graphs, and text created natively within Tableau.
Note that Tableau will export objects created within the tool at a high resolution. However, the imported graphics do not retain clarity when exported (even as an SVG).

Once both files were brought into Figma (the background image I previously created plus the Tableau exported SVG), I could easily overlay the SVG with my graphs and charts on top of my background image. Since both images have the same pixel ratio, they line up perfectly.

The result is a clearer image than the one exported directly as a PNG from Tableau. The final step is to export the combined image as a PNG at the desired resolution scale. The image is now perfect for printing or using in other documents as needed.
The difference in clarity is obvious when I zoom in on each image. Figure 9 shows how the Tableau export rasterizes the background image significantly compared to the image exported from Figma using the combined SVG files to create one image.

Final Thoughts
While Tableau isn’t primarily built for image handling, understanding how to optimize images within dashboards can significantly enhance the overall design and user experience. By addressing image clarity issues, streamlining updates, leveraging transparent backgrounds, and using high-resolution export methods like SVG, you can ensure that your visualizations maintain a polished, professional look when shown outside of Tableau, such as in PowerPoints, whitepapers, or marketing materials.
As the intersection between data visualization and design continues to grow, creative problem-solving with external tools will become even more valuable. With these image tricks in your Tableau toolkit, you can push the boundaries of what’s possible and utilize images of your dashboard in other mediums.
Do you have your own image optimization tips for Tableau? Share them in the comments below!
Comments
One response to “Using Images in Tableau: 4 Awesome Tricks”
great tips 🙂