
topic: Best Practices
-

Five Ways to Make Tableau Dashboards Run Faster (Part 1: Data and Query Tips)
Published by
on
We’ve all been there. You set out to build what you thought would be a great Tableau dashboard. When it’s all done, you realize the filter selections are lagging, charts are taking forever to load, and users are asking you what’s wrong with their report. Slow dashboards don’t just frustrate people; they also slow down…
-

Accessible by Design: Making Data Visualization More Inclusive with Tableau
Published by
on
In a world where data guides our actions, dashboards are essential for decision-making. Yet, what if the visuals and tools we rely on to share this data aren’t accessible to all individuals? For example, imagine the challenges faced when the screen readers that some people depend on can’t read charts, when colors are indistinguishable for…
-
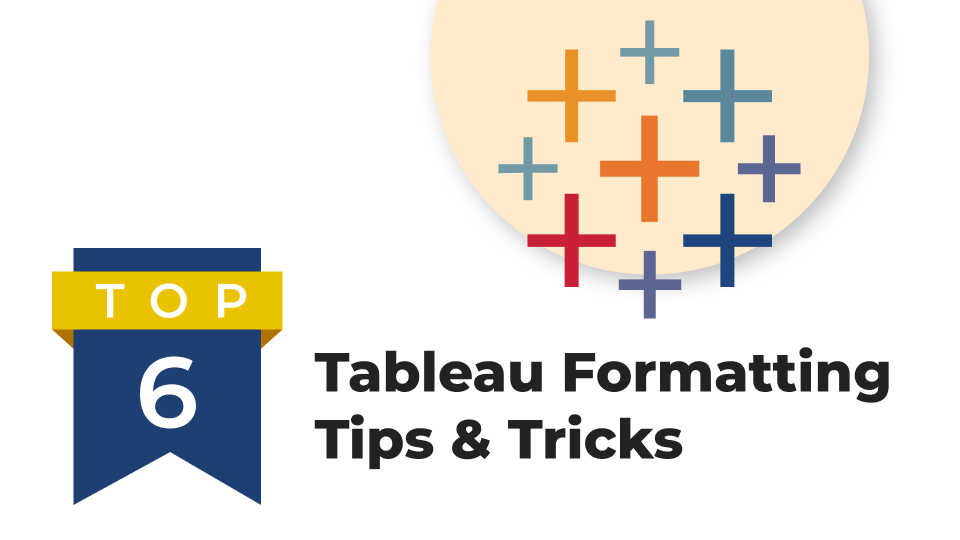
Six Easy Tableau Formatting Tips to Save You Time
Published by
on
Tableau is an incredibly versatile tool for creating data visualizations that can bring your insights to life. However, how you format these visuals can affect how easily your audience understands and interacts with your data. Whether you’re just beginning your Tableau journey or a seasoned pro, mastering formatting is key to taking your projects to…
-

Alternatives to Stacked Bars
Published by
on
Stacked Bar Chart or Some Other Display? As with all charts, we need to think first about the different types and characteristics of the data we are working with before deciding on the most appropriate chart type. We can ask questions such as: What do we need to tell our viewers? Do we need them…
-
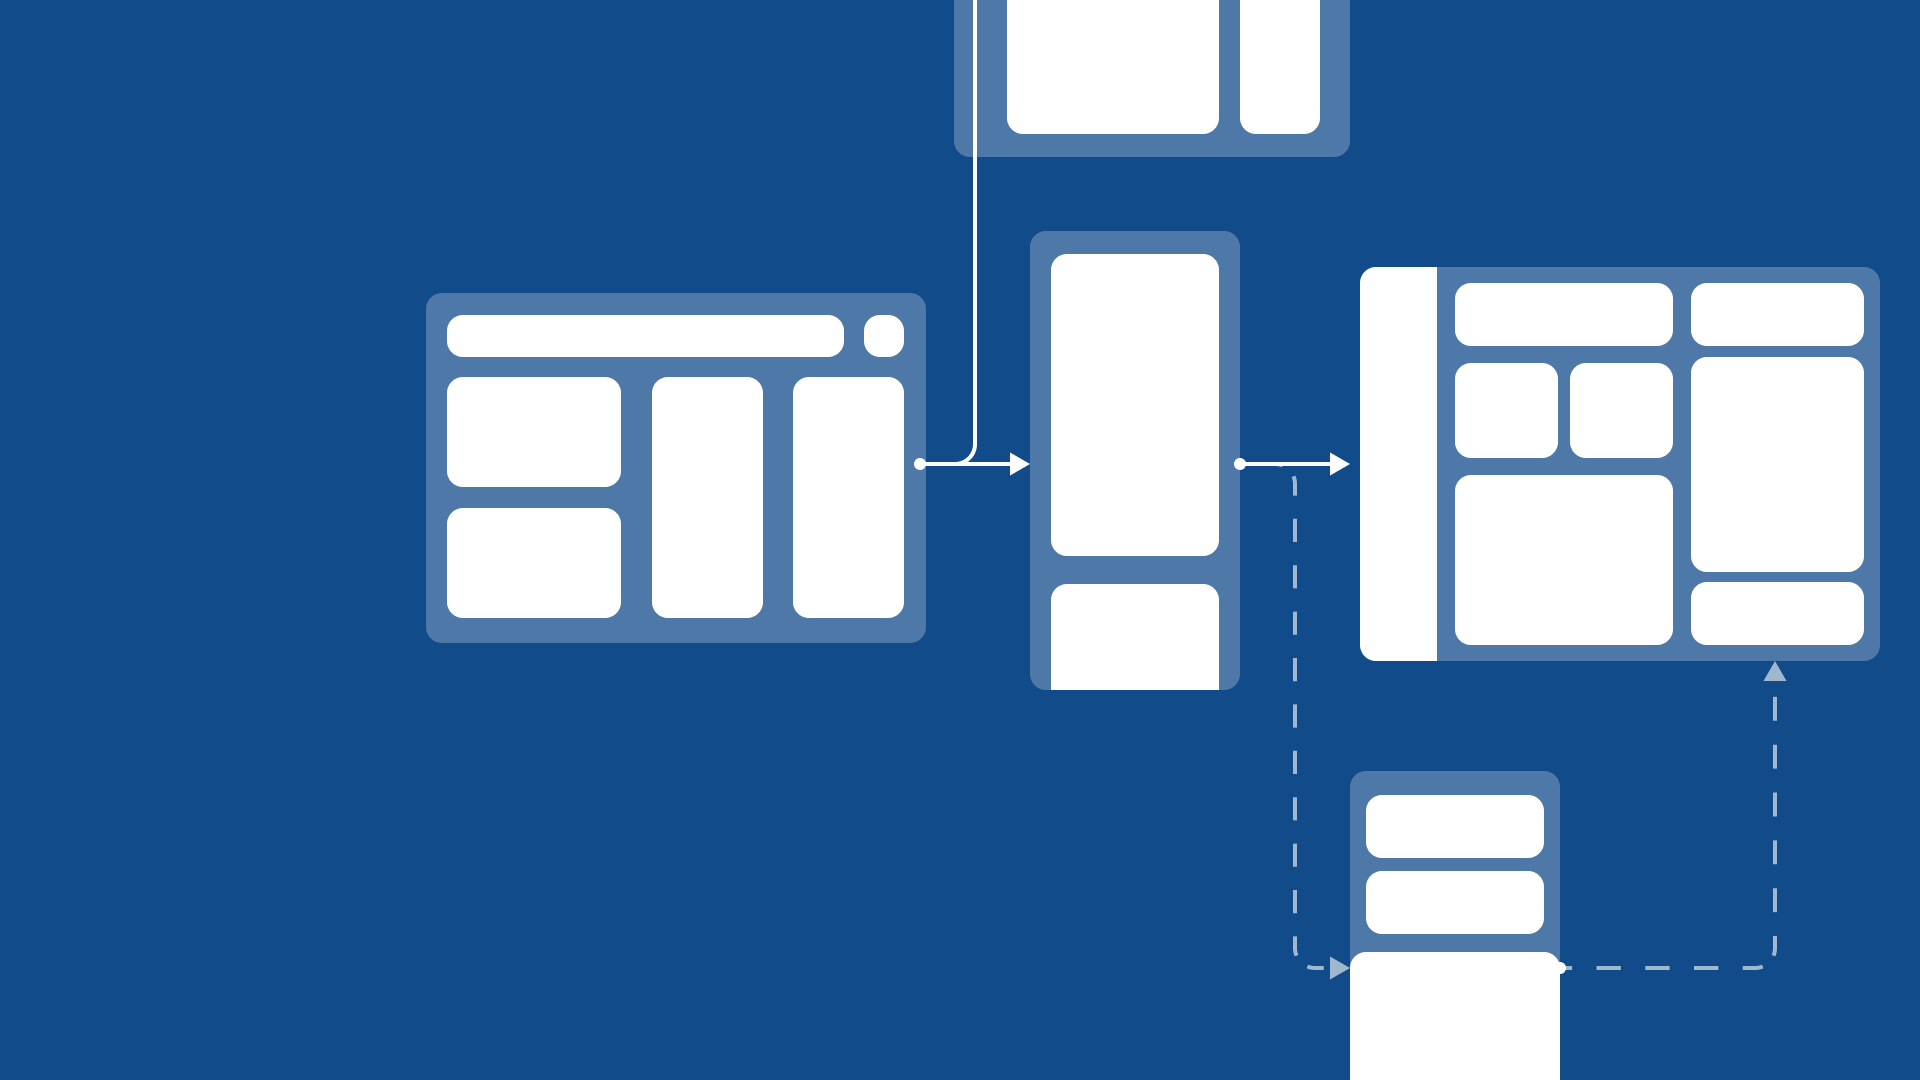
Prototyping: Building Better Dashboard Designs
Published by
on
If you had asked me 3 years ago if I sketched out or created wireframes for my dashboards before I built them in Tableau, I would have laughed a resounding, “No, are you crazy? I don’t have time for extra work!” I don’t think I’m alone in that initial sentiment. I’m here to tell you…
-
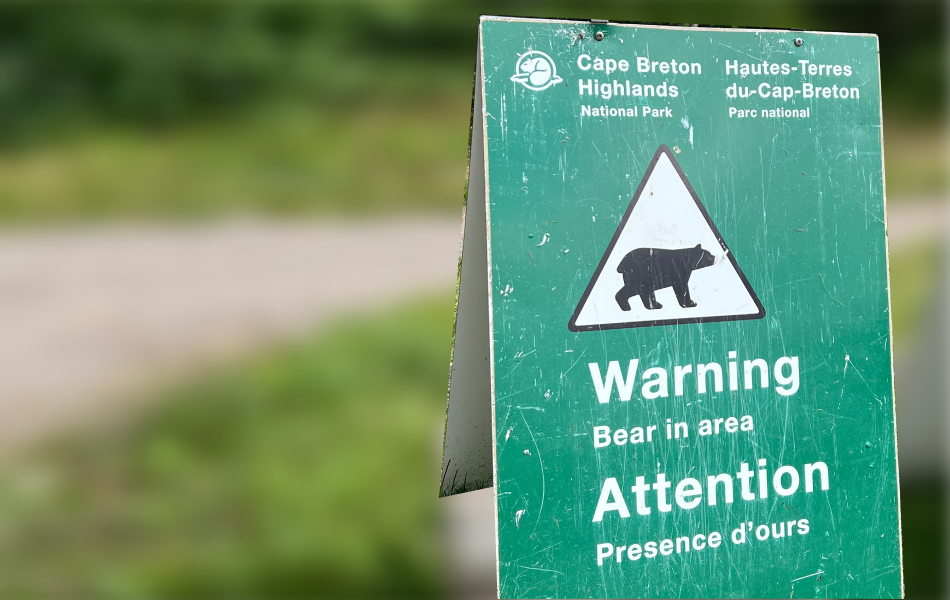
Look Here! Effective Use of Icons
Published by
on
Cliffs and Bears… OH MY! This past August my husband Bret and I were hiking in Cape Breton Nova Scotia when we came upon the following signs: You might think this would cause me, someone who is wildly afraid of heights and hungry bears, to consider different vacation options, but when I saw these views,…